
Every boater has been there. You check the forecast, plan your trip, and then the weather surprises you. Relying on just one app or website can be risky.
Modern weather predictions use numerical weather prediction. This is the science of solving physics equations for the whole atmosphere with huge computer simulations.
These simulations are called forecast models. They’re not just different apps showing the same data. Each one is a unique computer program with its own strengths.
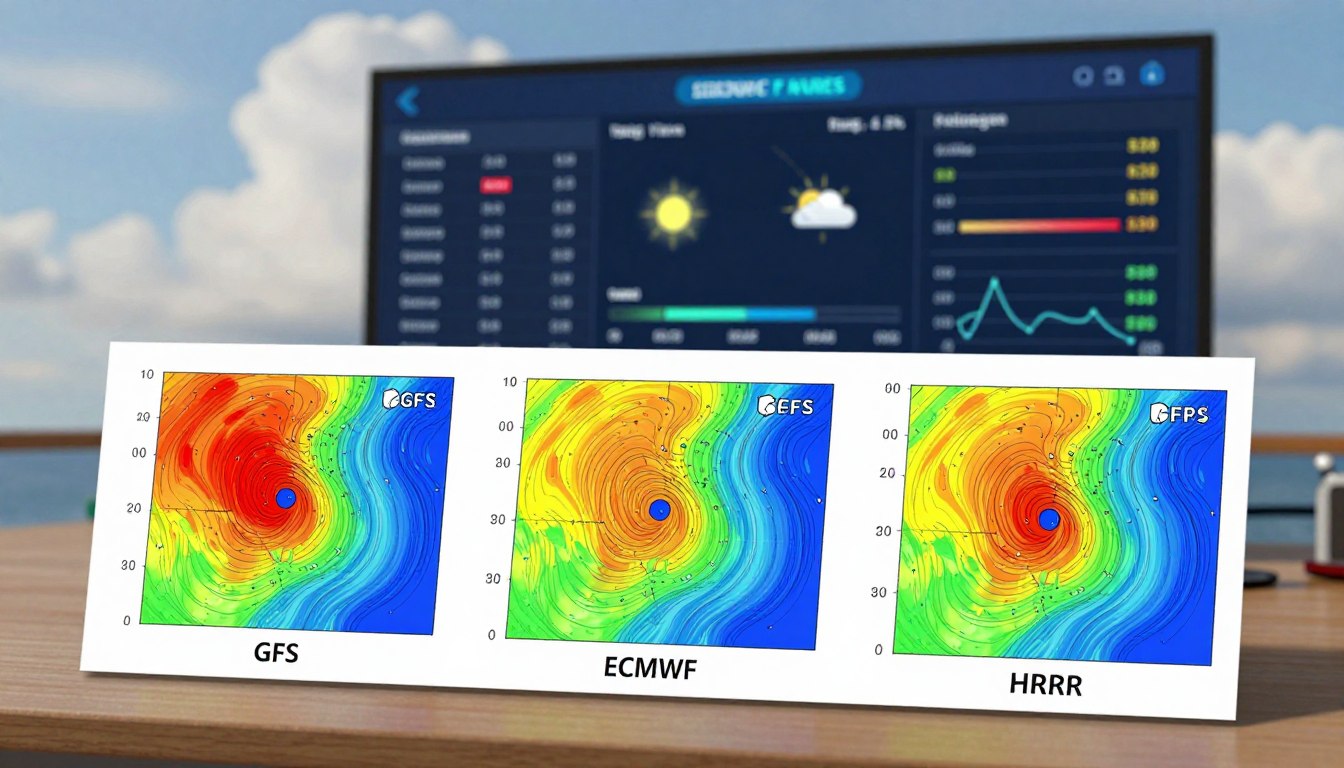
Big names include the American Global Forecast System (GFS), the European ECMWF, and high-resolution tools like the HRRR and NAM.
Because the atmosphere is chaotic, these forecast models often give different results. Knowing why is key for marine safety and planning smart trips.
Strengths/Weaknesses by Model & Coast
The trust you place in a wind forecast depends on the model’s design. This includes its resolution and how it works with your local coastline. Each major model gives a different view of the atmosphere.
In weather modeling, resolution is about the size of the grid boxes. Smaller boxes mean the model can see smaller details. This is key for boaters, as it helps with coastal features like inlets and sea breezes.

No model is perfect for every situation. Meteorologist Chris Parker blends outputs for better results. He uses GFS for the first 12 hours and GFS with NAM for the next 12 hours. This mix uses each model’s strengths.
The table below shows a comparison of the models boaters use.
| Model | Resolution | Update Frequency | Best-Use Case & Notes |
|---|---|---|---|
| GFS (Global Forecast System) | ~13 km | Every 6 hours | Good global baseline for planning 3-7 days out. Can miss local coastal effects and may over-forecast wind speeds in some regions. |
| ECMWF (European Model) | ~9 km | Every 12 hours | Often cited for superior medium-range (3-7 day) accuracy. Not freely available in all formats, making GFS a key public alternative. |
| NAM (North American Mesoscale) | ~12 km | Every 6 hours | Good for North American coastal forecasts 1-3 days out. Can over-develop sea breeze circulations, leading to skewed wind forecasts. |
| HRRR (High-Resolution Rapid Refresh) | ~3 km | Every hour | Excellent for hyper-local, short-term (0-18 hour) forecasts. Captures thunderstorms and local wind shifts well but has a very limited forecast range. |
| WW3 (Wave Watch III) | Varies | Varies with driver model | Specialized ocean wave model. Must be driven by wind data from GFS, ECMWF, etc. Crucial for assessing sea state, not direct winds. |
The ECMWF is known for its accuracy, thanks to its finer resolution and advanced data assimilation. But the GFS is free and updates more often. Many boaters use the GFS for planning and the ECMWF as a cross-check when it’s available.
Model biases vary by coastline. On the Atlantic Coast, the NAM can overstate sea breeze strength. The GFS might overestimate wind speeds in the Gulf of Maine. Use HRRR for same-day sailing there.
In the Pacific Northwest, complex terrain and fjords are a challenge. The GFS’s coarser resolution can miss strong local winds. The HRRR or ICON model often give better detail for the Puget Sound and Salish Sea.
For the Great Lakes, sudden wind gradients are a big concern. The HRRR’s hourly updates and fine grid are key for tracking afternoon thunderstorms and wind shifts. The NAM also works well over these inland seas.
Your location determines your model choice. Matching a model’s strengths to your local weather challenges is key to a reliable forecast.
How Far Out to Trust Each Model
Knowing a model’s run times is key for boaters. It’s about understanding when its forecasts are reliable. Each model has a trust horizon. Beyond that, its predictions become less sure.
Think of it like a flashlight. The HRRR shines brightly for the immediate future. The GFS and ECMWF offer a wider view for days ahead, but it fades with time. You need to know which light to use and when.
The High-Resolution Rapid Refresh (HRRR) model updates every hour. This makes it perfect for right now. Trust the HRRR for the next 6 to 18 hours for detailed wind shifts and thunderstorm forecasts. Its accuracy drops quickly after that.
For planning a weekend trip, you need a bigger picture. The GFS and ECMWF models update every 6 to 12 hours. Forecaster Chris Parker says the GFS is often most accurate in the 1 to 4 day range. These models are key for seeing the weather pattern. But, their certainty decreases each day.
After five days, all models start to diverge a lot. They begin from slightly different starting points. Small errors grow with each forecast step. At this range, never rely on a single model’s output. Use it only for spotting broad trends.
This timeline of trust is your most important tool. The following table breaks down exactly when to rely on each model for confident decision-making.
| Planning Horizon | Most Trusted Model(s) | Key Action | Notes on Run Times & Reliability |
|---|---|---|---|
| Today (0-18 hours) | HRRR, NAM | Make final go/no-go decisions. | Use the latest hourly HRRR run. NAM is good for 12-24 hour details. |
| 2 to 3 Days Out | GFS, ECMWF | Watch for model convergence or disagreement. | GFS peaks here. Compare multiple runs for consistency. Model agreement becomes critical at this range. |
| 4 to 7 Days Out | GFS/ECMWF Ensemble Means | Spot general trends only. Do not fixate on details. | Specific wind speeds and times are unreliable. Look for major pattern shifts like incoming fronts. |
| Beyond 7 Days | All Models | Ignore for specific planning. | Use only for very broad climate outlooks. Forecast skill is very low. |
One final, non-negotiable rule: always check the timestamp of your forecast. A “GFS forecast” could be from a run 6 hours old. New data is constantly ingested. The most recent run times provide the best starting point for the model’s physics. By matching your planning horizon to the correct model’s reliability window, you turn raw data into a trustworthy forecast.
Using Ensembles & Percentiles
The most critical upgrade to your weather forecasting skill is shifting from a deterministic to a probabilistic mindset.
Instead of asking, “What will the wind be?” you start asking, “What is the range of possible winds, and how likely is each outcome?” This is the power of model ensembles.

An ensemble is not a single model. It is a set of many forecast runs. These runs can come from different global models or the same model with slight tweaks. This creates a spread of possible futures.
The pattern of this spread tells you everything. When the lines cluster tightly together, models are in strong agreement. Confidence is high. When the lines fan out wildly, the models are confused. Uncertainty is high. This is the professional’s Convergence Rule.
Consider a forecast for 15 knots. If the GFS, ECMWF, NAM, and ICON all show values between 13 and 17 knots, that forecast is solid. If the same models spit out 8, 15, 17, and 25 knots, that “15-knot” forecast is highly suspect. The spread reveals the truth the single number hides.
This is where percentiles become essential. They translate the model spread into actionable odds. The 90th percentile wind speed means there’s only a 10% chance winds will be higher than that value. It’s a worst-case-scenario boundary for planning.
The biggest mistake is to cherry-pick the single, most favorable model run—a practice called forecast shopping. It’s a guaranteed way to be caught off guard. The professional practice is to weigh the strengths of each model and then plan based on the worse end of the ensemble spread when disagreement is high.
By analyzing ensembles and percentiles, you stop looking for a single answer. You start managing risk with data. This multi-model analysis is how you move from hoping the forecast is right to knowing how much you can trust it.
Practical Cross‑Check Routine with Examples
A good cross-check routine is key for experienced sailors. Start by observing real-time data. Look at offshore buoy reports and webcams against the HRRR or NAM forecast models. This is how experts like Hank Pomeranz figure out which model is most accurate.
For trips two to three days ahead, compare the GFS and ECMWF forecasts. Look for any agreement in trends. Use a multi-model app to see the “spaghetti plot” for better understanding. If models don’t agree, plan for the worst. Never rely on forecasts more than four days ahead.
Always check the NOAA Area Forecast Discussion (AFD). It offers expert insights on which models are favored. Combine this with NOAA’s real-time current maps for a full view.
Let’s say you’re planning a Saturday offshore trip on Wednesday. The GFS predicts 15 knots, but the ECMWF suggests 25. The HRRR matches current buoy data. The AFD warns of low confidence in the GFS due to a weak front. The best choice is to delay or take a safer route. This method, using live data, various forecast models, and expert analysis, is your best tool.