
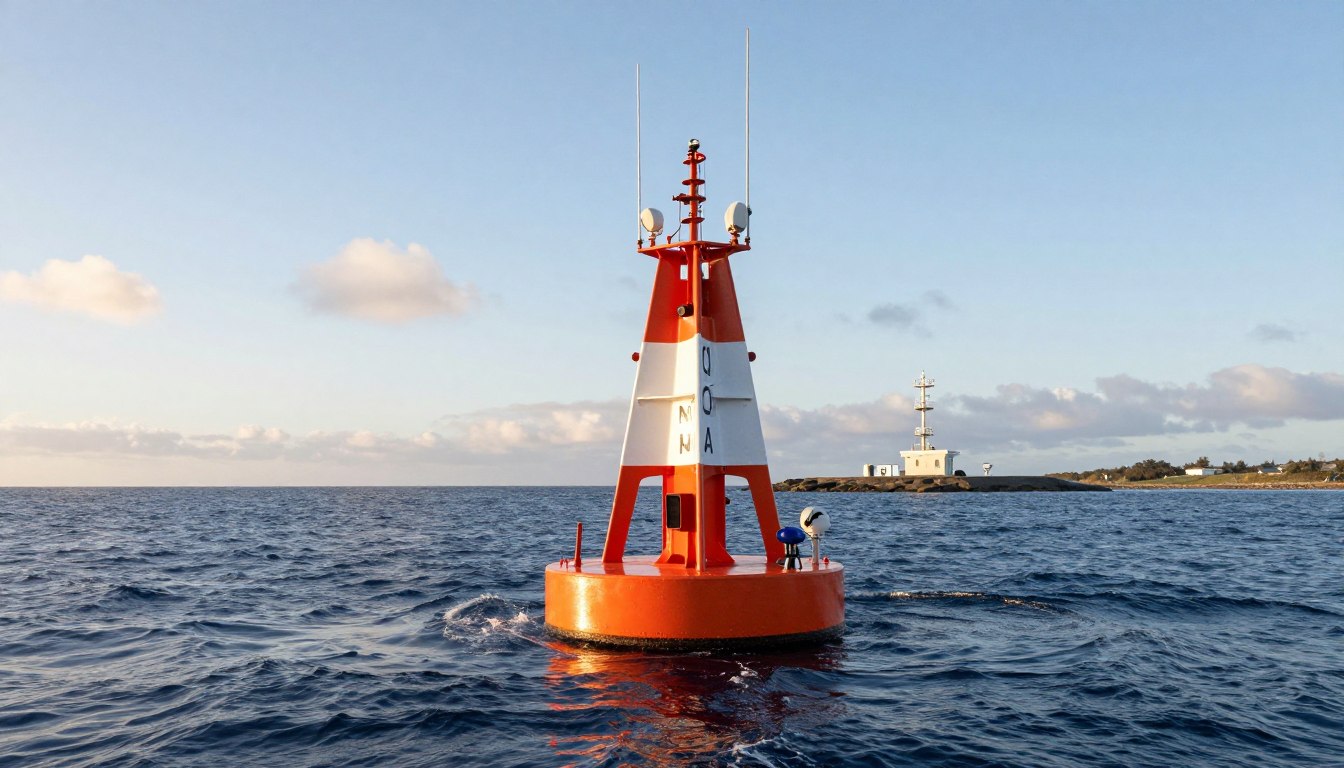
The sea is always changing. For those on the water, knowing their surroundings is key for safety and efficiency.
A network of automated sentinels provides this vital info. NOAA buoys, Coastal-Marine Automated Network (CMAN) stations, and harbor sensors are part of it. The National Data Buoy Center (NDBC) collects and shares this important data.
These platforms send out constant updates. They measure water level, wind speed, air and water temperature, barometric pressure, and wave details.
Using this live data is not just a good idea. It’s essential for safe and smart navigation. For a real-time guide to local boating conditions, this data is a must.
Interpreting Live Data (wind, gusts, waves)
Learning to read real-time wind, gust, and wave data is key. It sets apart those who truly understand the weather from those who just check it. The numbers on a buoy report tell you exactly what’s happening with your boat.
Wind is the main force at play. Data shows wind direction as true directions from which the winds blow, in degrees from true north. For example, “270°” means the wind is coming from the west. Speed is in sustained knots, showing the average wind speed over time.
The “Gusting to:” value is very important. It shows the highest wind speed in a short time. Gusts can put a lot of stress on your boat. A big difference between sustained and gust speed means the air is very unstable. This means you should be more careful with your sail plan and speed.

Wave data shows what the wind has done. The significant wave height is key. It’s the average height of the highest one-third of waves. If it’s 8 feet, expect many waves around that size, with some bigger ones possible.
The dominant wave period is also important. It’s the time between successive wave crests, in seconds. A longer period means bigger, smoother waves. A short period means steeper, choppy waves. These are harder on your boat and crew.
Wind, wave height, and period all work together. Wind from one direction for a long time makes bigger waves. A sudden wind change makes the sea choppy. You need to look at all these factors to predict what’s coming.
To know if readings are safe, know your boat’s limits. Look at trends. Are winds and waves getting stronger? Then, put it all together. High winds with long waves might be okay offshore. But the same winds with short waves are dangerous near shore.
Getting better at this takes practice. For a detailed guide, check the official data decoding guide. It turns the live data into a map for your journey.
Matching Buoy Readings to Your Route
Planning your voyage well means linking buoy data to your route’s challenges. This turns data into useful information.
To plan your passage, you need to use live buoy data. This isn’t just about looking at numbers. You must also map these readings onto your route.

First, find buoys and CMAN stations on your path. Plot their locations against your waypoints. It’s important to know how conditions at the buoy will affect your journey.
Currents are rarely uniform. A buoy reports current speed and direction at its exact location. You need to consider how currents change as you move. Check the U.S. Coast Pilot for current patterns.
Water temperature data is also key but often overlooked. Sharp temperature changes can affect your vessel’s performance. Cooler water can increase friction. Also, these changes can lead to sudden fog.
To use this data, follow a three-step process:
- Locate: Find the right data sources for your route.
- Translate: Understand how the data affects your vessel.
- Calculate: Adjust your plan for safety, like under-keel clearance.
Controlling depth is critical. Charts show depth, but the safe depth can be less. You need to calculate the actual under-keel clearance. This includes the charted depth, tide level, and vessel dynamics.
Here’s a comparison of buoy data and navigational factors:
| Buoy Data Parameter | Navigational Factor to Assess | Planning Action |
|---|---|---|
| Current Speed & Direction | Set and Drift on Course | Adjust heading to compensate; calculate ETA change. |
| Water Temperature | Risk of Fog & Hull Efficiency | Prepare for reduced visibility; anticipate speed loss. |
| Wave Height & Period | Vessel Motion & Comfort | Consider course alteration to avoid beam seas. |
| Real-time Water Level | Under-Keel Clearance | Recalculate clearance using actual depth, not chart datum. |
Always use the most conservative data. If a buoy shows waves building, plan for them to be higher by the time you arrive. If water temperature is dropping, expect fog. This approach is key to safe route management.
Remember, safety is more than avoiding storms. It’s about keeping enough depth, managing stress on the vessel, and watching for hidden dangers like thermal fronts. By matching readings to your route, you create a dynamic safety net.
Alerts & Subscriptions
Imagine getting a push notification when winds at your departure point are too high. This is what modern buoy alert systems offer. They move from manual checks to automated warnings, changing safety and planning.
Reliable alerts start with good data transmission. Modern buoys use 5G and satellite communication like Starlink. This tech sends data in real-time, even in remote areas.
You can set up customized alerts for things like wind speeds or wave heights. You can also track sea surface temperature or pressure. These thresholds turn buoy data into a safety tool.
There are many subscription options for these alerts. NOAA offers services through its websites and data portals. Apps like the NOAA Marine Weather Community app make it easy to get real-time data and alerts.
The table below compares common alert delivery methods to help you decide.
| Delivery Method | Best For | Typical Latency | Reliability Offshore |
|---|---|---|---|
| Email Alert | Detailed forecasts, planning ahead of departure | 5-15 minutes | Low (requires internet) |
| SMS Text Message | Critical, must-get warnings (e.g., Gale warning) | 1-3 minutes | High (uses cellular network) |
| Mobile App Push Notification | Active mariners with app open frequently | Near-instant | Medium (requires data connection) |
| VHF Weather Radio (NOAA Weather Radio) | Broadcast alerts for all vessels in an area | Depends on broadcast schedule | Very High (radio signal) |
To build your system, follow these steps:
- Identify Key Buoys: Choose the stations along your route.
- Define Your Limits: Set your wind and wave values.
- Choose Your Service: Sign up for NOAA alerts or use a third-party app.
- Test the System: Set a test alert to ensure notifications work.
This proactive approach is key to monitoring marine forecasts. You’re not just reading the water; it’s reporting to you. With subscriptions and alerts, you have a 24/7 safety net. It’s powered by the latest buoy data technology.
Case Study: Go/No‑Go with Buoy Data
The Naval Postgraduate School in Monterey Bay has a cutting-edge maritime platform. It combines weather and ocean sensors with AIS, radar, and cameras. This setup gives a full view of the maritime area.
Imagine a research team deciding whether to launch. They look at data from the NPS system. They see wind gusts at 38 knots and a chaotic sea state.
Radar images show thick fog in the main path. AIS data shows big cargo ships moving in the fog.
This mix of data—wind, waves, fog, and ship traffic—clearly shows the risks. Thanks to 5G, the team makes a firm no-go decision.
This example proves the value of using NOAA buoys and other sensors. It turns raw data into useful information for safety and success.