

For centuries, sailors used the sky, sea, and instinct. Now, technology offers a new tool: digital weather maps.
These aren’t just pictures. They are gridded data packets called GRIB files. Each file is a detailed forecast, giving exact info for ocean points.
This data includes key details like wind speed and direction, atmospheric pressure, and wave height. It turns vague weather forecasts into clear, detailed pictures of what’s coming.
For sailors planning routes, this info is a big change. It lets you analyze more than just a basic forecast. You can see how wind might change hour by hour on your path.
To understand this data, you need the right tools. Special GRIB viewers are key. They turn complex numbers into clear, colorful charts you can use at sea.
This guide will help you grasp these files and use GRIB viewers for better, safer sailing.
What a GRIB Contains
A GRIB (Gridded Binary) format file is a grid of numbers. Each number shows a weather condition at a specific map location. To make sense of this data, you need GRIB viewers software.
These viewers decode the file and plot each data point. They connect the dots to create layers you can understand. The main layers include wind, pressure, waves, and more.
| Core Parameter | How It’s Shown | What It Tells You |
|---|---|---|
| Wind | Arrows (vectors) or wind barbs showing speed and direction. | The force you’ll feel on deck and the push on your sails. |
| Atmospheric Pressure | Isobars (lines connecting equal pressure). | Pressure gradients indicate wind strength. Tight spacing means stronger winds. |
| Waves | Wave height, direction, and period. | Sea state conditions affecting boat speed, comfort, and safety. |
| Ocean Currents | Vector arrows showing speed and set. | Helpful or hindering flow that impacts your course over ground. |
| Precipitation & Cloud Cover | Shaded areas or percentages. | Likelihood of rain and overall visibility conditions. |
Wind and pressure are closely linked. Closely spaced isobars mean strong winds. Modern GRIB viewers color-code wind speeds, making strong areas clear.
Wave data is also key. Significant wave height shows the tallest wave average height. Wave period tells you the time between crests. Longer periods mean more powerful swells. You can analyze these factors with your GRIB viewer.
Not all GRIB files have every layer. Currents and precipitation are often optional. The skill is in combining all data. You look at wind vectors, pressure patterns, and wave action. This is what GRIB viewers do best.
By combining these layers, you get a full weather picture. This is key for planning. It’s only possible with a good GRIB viewer.
Getting GRIBs Offshore (cell/satellite)
Getting fresh GRIB files at sea means using special satellite or cellular systems. When you lose cell service, these systems are your only option.
There are two main ways to get data: satellite networks like Iridium, and cellular networks near the coast. Your choice depends on where you are and your budget.
To get the data, sailors use two main methods:
- Auto-Responder Email Services: You send a special email to Saildocs. A satellite modem then sends you the GRIB file.
- Integrated Routing Apps: Apps like PredictWind or LuckGrib do it all for you. You pick an area, and the app gets, downloads, and shows the data.
Routing apps make things easy. They do everything in one place. You don’t have to deal with emails or load files into other software.
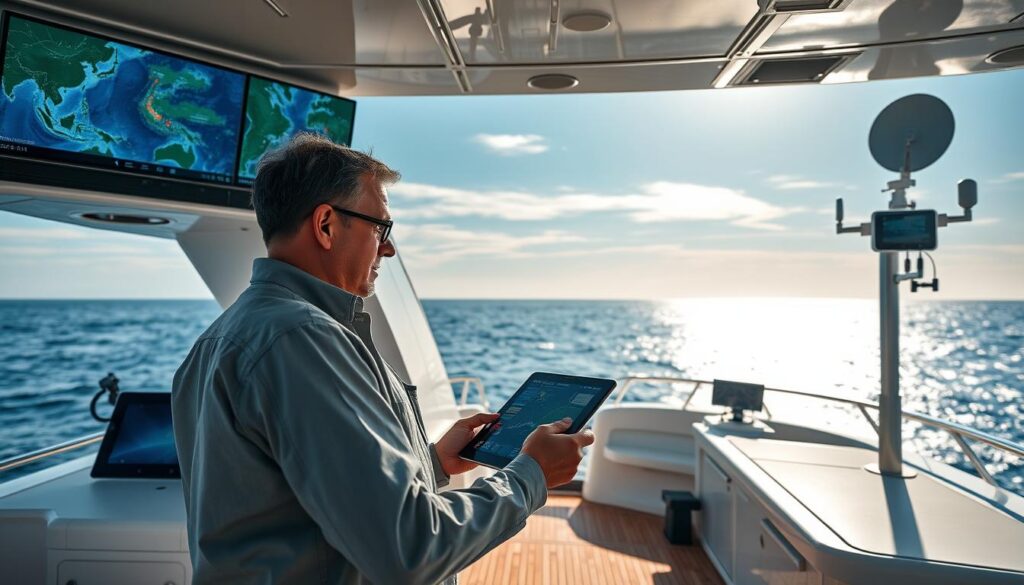
For satellite use, the Iridium GO! is a common choice. Setting it up right is key. Make sure the antenna has a clear view of the sky. Keep it away from masts or other things that might block the signal.
Costs are important to think about. Iridium has plans, including one for unlimited data, great for frequent updates. Apps like PredictWind cost a subscription, while LuckGrib is a one-time buy.
Choosing the right system is all about what you need. For simple updates, email might be enough. But for detailed planning with charts, routing apps are better. Test your setup before you go.
Simple Routing with Safety Margins
To make a useful sailing route from GRIB forecast data, you need two things. First, know your boat’s performance. Second, add a bit of caution. This method, called basic weather routing, uses software to find the quickest or most comfortable path.
Your boat’s polar diagram, or polars, is key. It’s a model of your boat’s speed based on wind and angle. This model helps the software figure out how fast your boat can go.
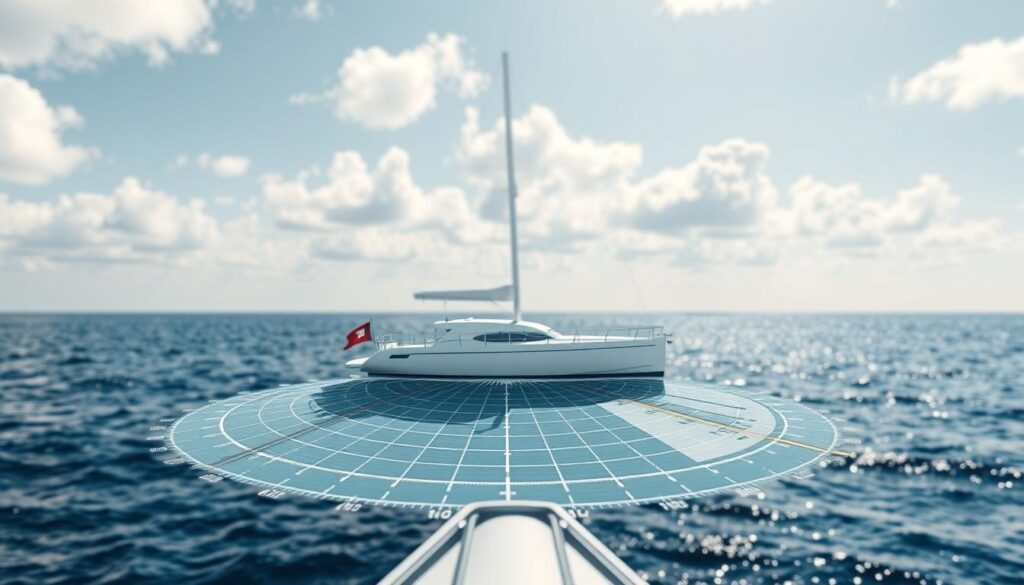
Think of polars as a speed chart for your boat. When the software reads a GRIB file, it sees wind and your boat’s speed at every point. This info helps the software find the best route.
The isochrone algorithm is a common method. It looks at all possible headings and speeds based on your polars and the forecast. Then, it connects the dots to find the fastest route.
The result is the optimal mathematical solution. But, it’s not the only solution. Small changes in polars or forecast can change the route.
It’s important to add safety margins. A fast route might lead to rough seas or high winds. Adjusting the software to reflect your limits is key.
Set comfort and capability filters to avoid risky routes. Consider crew fatigue, vessel strength, and your comfort with rough weather. This makes the route safer.
Always add a buffer to the forecast. If you’re not comfortable in 25 knots, set the limit to 20 knots. This helps with forecast errors and gusts.
Adding these human factors makes the route practical and safe. This planning also considers safe harbors along the way. It turns a theoretical line into a practical and secure sailing plan.
| Safety Margin Factor | Software Setting | Practical Consideration |
|---|---|---|
| Wind Strength | Max True Wind Speed Limit | Set this 5-10 knots below your actual comfort or safety threshold to account for GRIB forecast error and squalls. |
| Wave Height | Max Significant Wave Height | Base this on vessel size, crew experience, and the period of the waves. A steep, short-period sea is more punishing. |
| Boat Performance | Polar Diagram Selection | Use conservative polars, perhaps 90% of your boat’s possible speed, to model average passage-making pace, not peak racing performance. |
| Crew Comfort | Motion Comfort / Wind Angle Filters | Filter out points of sail known to cause excessive heeling or slamming, even if they are theoretically faster according to the polars. |
By adding these margins, you get the best prudent route. Your boat’s polars are the engine, but your judgment is the steering.
Limits & Human Oversight
GRIB files and automated routing apps are very useful. But, they are not foolproof. Forecast models like GFS and ECMWF give predictions, not guarantees. Their accuracy drops off after a few days.
They might miss sudden squalls or changes in wind speed.
Your boat’s performance data, stored as polars, is an estimate. Real sailing includes waves, currents, and how you handle the sails. Routing apps use these estimates to suggest a route. But, this route is just a guess, not a sure thing.
Human oversight is key to safety. Always check different forecast models. See how the wind and sea really are. Use routing app outputs as a starting point, not the last word.
The skipper is always responsible for the boat’s safety. Good weather routing mixes tech with experience. Trust your tools, but always check with your own eyes and experience.