
Planning a hike, sail, or picnic? The sky above holds clues about what’s coming next. Long before modern forecasts, people used simple instruments like the barometer to read the atmosphere’s mood.
This tool doesn’t just show a number. It tells a story of coming change. By watching the pressure trend—whether it’s rising, falling, or steady—you can draw smart inferences about future conditions.
Is it going to be stormy, rainy, fair, or very dry? The change in pressure is your most valuable hint. It’s more critical than any single reading on the dial.
Mastering this skill turns observation into reliable prediction. It boosts safety and fun for anyone spending time outside. This guide will build your core barometer skills, helping you interpret key pressure trends like a pro.
Installing & Calibrating a Barometer
Before you can understand pressure trends, your barometer needs to be set up right. A bad installation or uncalibrated device gives you no useful data. It can’t warn you of storms coming.
Calibration is like setting a watch to the right time. If it’s off, you’ll miss all your appointments. The same goes for barometric pressure.
Finding the Perfect Spot
First, choose the right spot. Hang your aneroid barometer or place your digital unit on a solid, inside wall.
Avoid these common trouble spots:
- Drafts from doors or windows: Sudden air changes mess up the reading.
- Direct sunlight or heat sources: Radiators and appliances cause the device to expand.
- Vibration: Keep it away from heavy foot traffic or machinery.
Choose a spot that’s indoors, stable, and not too hot or cold. This lets the sensor measure real atmospheric changes, not just room noise.
The Calibration Process
Calibration sets your barometer to show sea-level pressure. This lets your local reading match weather maps.
Most aneroid barometers have a small adjustment screw on the back. Use a flathead screwdriver for this.

First, find the current sea-level pressure for your area. Use a trusted source like the National Weather Service website or a major airport report.
Next, gently turn the screw until the needle points to that exact pressure. Move it slowly. You don’t want to damage the delicate mechanism inside.
For digital models, check the manual. The process often involves holding a button while entering a known pressure value.
Why This Step is Non-Negotiable
If your starting pressure is wrong, every trend you observe will be misleading. You might see a falling trend and think a storm is coming when pressure is actually steady.
More importantly, you break the link to professional forecasts. Meteorologists use lines of equal pressure called isobars on weather maps. Your local reading must correlate to those map isobars for any analysis to work. An uncalibrated barometer makes this impossible.
| Method | How to Do It | Best For | Notes |
|---|---|---|---|
| Local Airport METAR | Find the nearest airport code. Search for its “METAR” report online. Use the “altimeter” value. | Most accurate local standard. | METAR reports update hourly. Use the most recent one. |
| Trusted Weather App | Use a reputable app like WeatherX. Check its “barometric pressure” reading for your town. | Convenience and digital calibration reference. | Apps like WeatherX provide calibrated digital forecasts, a good benchmark. |
| Official NWS Report | Visit the National Weather Service website. Use the pressure from the forecast office for your area. | Official, reliable data source. | Often includes pressure trend data as well. |
| Known Altitude Adjustment | If you know your exact elevation, use an online calculator to adjust a sea-level report to your height. | Remote locations without local reports. | This is complex. It’s better to verify with another method later. |
A Note on Digital Barometers
Digital units can be great. But, their raw sensor data can sometimes be noisy. Proper setup and placement help minimize this.
Always check your digital unit’s reading against one of the verification methods in the table above. Modern solutions like the WeatherX app make this easy. It delivers calibrated digital forecasts right to your phone. It’s a great way to compare your onboard instrument.
Spending time on proper installation and calibration is key. Your readings will now accurately reflect the atmosphere’s behavior. This lets you confidently read trends and understand those all-important weather map isobars.
Reading Trends (3‑hr/24‑hr rules)
The 3-hour and 24-hour rules are time-tested techniques that transform your barometer from a simple instrument into a reliable forecasting tool. These rules are classic algorithms sailors use to classify conditions as “fair” or “rainy” based solely on pressure trends.
The 3-Hour Rule focuses on short-term changes. Check your barometer now and note the reading. Check it again in three hours. If the pressure has risen steadily, expect continued or improving fair weather. If it has fallen steadily, prepare for deteriorating conditions, often meaning rain or wind is on the way.
The 24-Hour Rule gives you the bigger picture. Compare today’s reading to the pressure from exactly 24 hours ago. A significant rise over a full day strongly suggests a stretch of stable, high-pressure weather. A significant fall indicates an increasing chance of stormy conditions moving into your area.
To use these rules effectively, log your readings. Write down the pressure every few hours. A rapidly falling needle warns of an approaching storm system. A slow, steady rise hints at calming weather. A steady pressure means the current conditions are likely to persist.
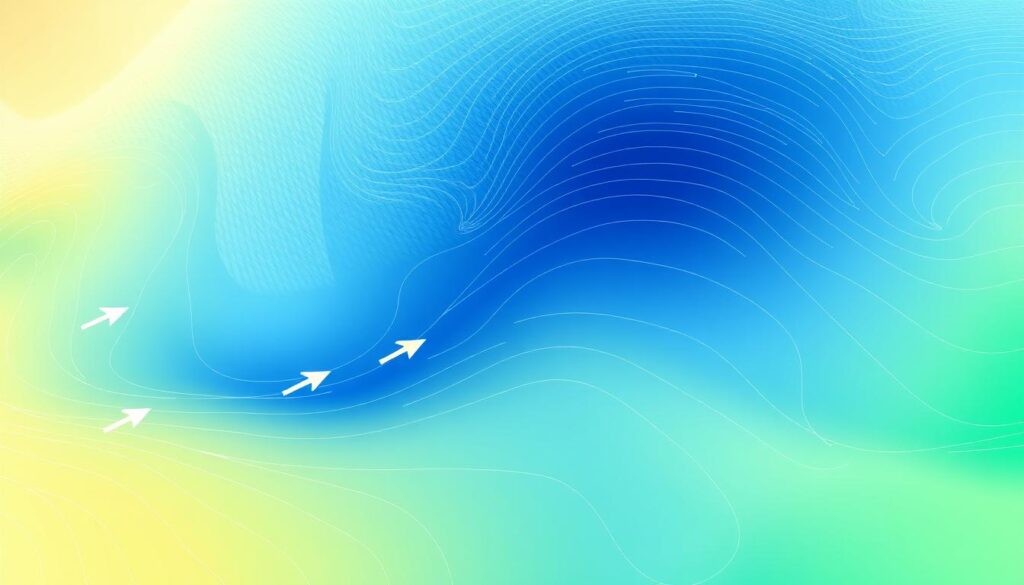
On a weather map, these pressure differences are shown with lines called isobars. When isobars are packed tightly together, it shows a strong pressure gradient. This steep difference in pressure over a short distance is the engine that drives the gradient wind.
Understanding these trends allows you to predict not just rain or shine, but also wind strength. A tightening pressure gradient, signaled by a rapidly falling barometer, means strengthening gradient wind is likely. By applying the 3-hr and 24-hr rules, you forecast both the weather type and its possible force.
Interpreting Tight Gradients & Fronts
Learning to read the signs of weather fronts is key to using your barometer’s full power. It’s not just about simple trend lines.
A tight pressure gradient means a quick change in air pressure over a short distance. On a weather map, this looks like isobars that are very close together. This is what causes strong winds.
The tighter the gradient, the stronger the wind will be. Your barometer shows you the pressure changes from the ground up. A fast-moving needle means you’re near a strong gradient.
Fronts are where these gradients are most intense. Each front—cold, warm, occluded—leaves a unique mark on the pressure trend. Knowing this helps you guess what’s coming.
Cold fronts are easy to spot. The pressure trend drops steadily as the front gets closer. After it passes, the pressure jumps up quickly. This shows cooler, denser air has arrived.
Warm fronts and occluded fronts have different signs. The pressure drop before a warm front is slower. The rise after is also slower and less sharp. Occluded fronts have a more complex pressure trend, with falls, steady periods, and rises.
This knowledge helps you act fast. A steep, steady drop in pressure means a big change is coming. It means stronger winds and a big shift in weather. Knowing this lets you plan better.
By understanding gradients and frontal signs, you go from just watching the weather to predicting its strength and timing.
Pairing with Cloud Clues & When to Shorten Sail or Seek Harbor
A falling barometer trend means something when you look up at the sky. Lowering cumulus clouds and a steady pressure drop often mean rain is coming. This mix of data and visual clues gives you the best forecast.
Deciding when to be safe means setting your own rules. If pressure drops fast and clouds get thick, it’s time to adjust your sails or seek shelter. It’s better to be safe than sorry. Tools like the WeatherX Forecast app help by showing animated isobars and pressure changes, sending alerts ahead of time.
Combine these forecasts with what you see and feel. Check local boating conditions for real-time data or tide info. Tight isobars on a chart mean strong winds, backing up what your barometer and clouds tell you.
Your last skill is combining all signs—the barometer’s trend, the sky’s look, and digital forecasts. This complete set helps you make smart choices for a safe journey back.