
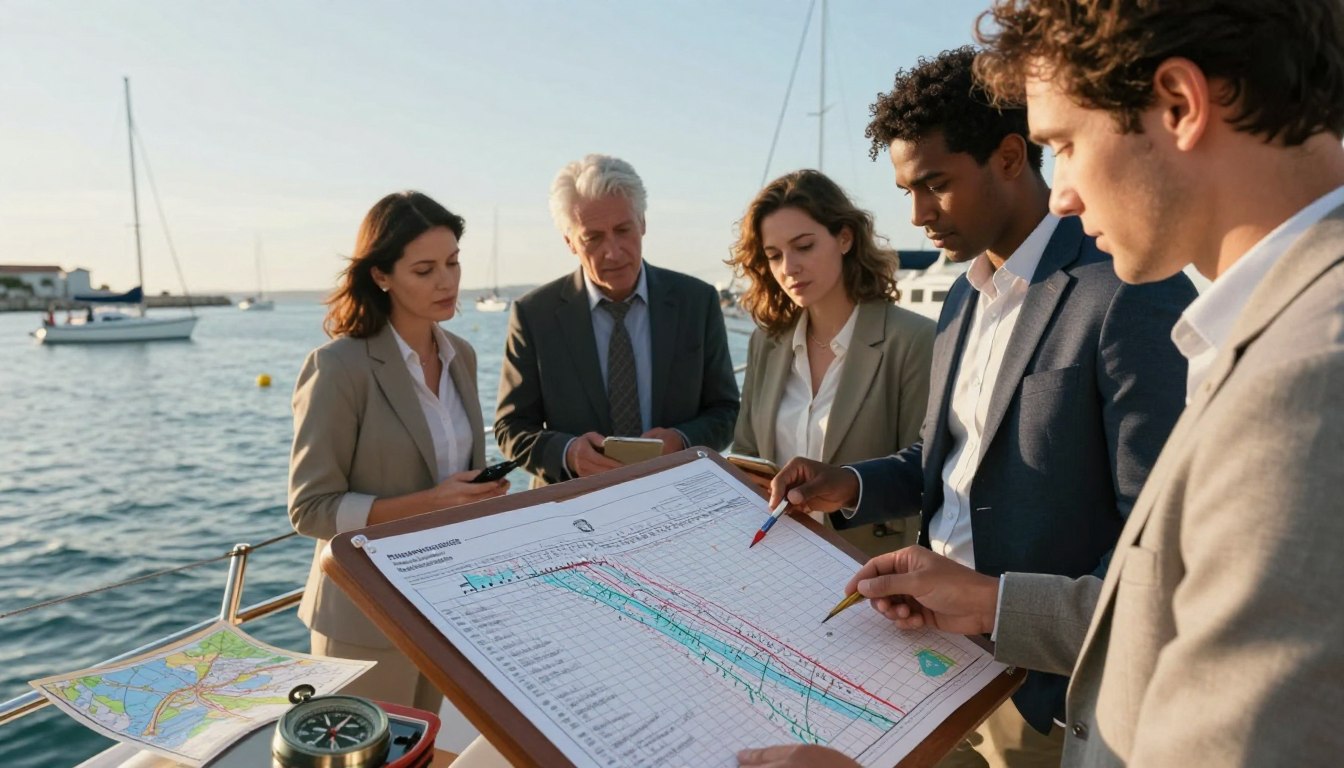
Coastal navigation is a unique challenge. The water beneath your boat is always moving. This movement is caused by the moon and sun’s gravitational pull.
This dance of the moon and sun affects your boat. It changes the depth of water over shoals and at docks. It also creates currents that can help or hinder your journey.
Tide charts are your most important tool for navigation. They give precise predictions of water levels and currents. They are essential for safe and efficient planning of your voyage.
Learning to use these charts lets you plan with confidence. You can schedule a departure to catch a favorable current. You can plan an arrival for enough depth at tricky inlets. You can also figure out how long you can safely anchor before the water recedes.
Understanding the data on tide charts is the first step. It changes you from reacting to the water’s movement to commanding it.
Reading Tide Tables (Heights, Datum)
Learning to read a tide table is key to understanding maritime timing. These charts are more than just simple graphs. They are essential for planning your time on the water, predicting high and low water times and heights.
A standard tide table has clear columns for the date, time of each tide, and the tide height. Times are in local 24-hour clock. Heights are in feet or meters above a fixed baseline called the datum.
Knowing the datum is vital. In the U.S., the common datum is Mean Lower Low Water (MLLW). It’s the average of the lowest tide over many years. Depths on your nautical chart are from this baseline. A tide table’s “+5.0 ft” means the water will be five feet above MLLW at that time.
The tide range is the difference between high and low water predictions. You find it by subtracting the lower height from the higher one. This number is very useful for sailors.
A big tide range means water depth changes a lot during the day. It also means stronger currents. A small range means milder conditions and less current. Knowing the tide range helps you prepare for these changes.
Using this knowledge turns raw data into a safety plan. By comparing predicted heights with your chart’s depths, you can find safe times to travel. The tide range also helps you plan for anchorage, ensuring enough swing room. This is a critical step in planning your journey.
Finding Local Reference & Secondary Stations
To predict the critical moment of slack water at your anchorage or inlet, you must first pinpoint your local tidal reference station. Primary tide tables cover major ports, but your cruising destination is likely a secondary station. Using data from the wrong location is a common and dangerous mistake.
Your first step is to find the correct Reference Station. This is the primary, well-documented port nearest to your area. Think of it as your tidal baseline. All local predictions for smaller bays, inlets, and coves are calculated as offsets from this station’s data.

Next, you must apply corrections to find data for your Secondary Station. These are the specific spots you care about. Navigation resources list these stations with two vital numbers: a time difference and a height ratio.
For example, if your reference station high tide is at 1200, and your secondary station has a “+1:15” time correction, the local high tide occurs at 1315. The height ratio works the same way. If the reference station predicts a 6.0-foot tide and your secondary station has a 0.8 height ratio, your local tide will be about 4.8 feet.
This precise localization is not academic. It is the only way to accurately forecast slack water—the brief window of minimal current between flood and ebb tides. Slack water is your golden opportunity for safe passage.
Why is timing for slack water so essential? Strong tidal currents create significant hazards, making navigation in confined waters dangerous.
- Transiting Narrow Inlets: Opposing currents can drastically reduce steering control. A strong ebb current rushing out against incoming ocean swells can create steep, breaking waves at the bar.
- Passing Under Bridges: You need to calculate both air clearance (from tide height) and waterway safety. Fighting a 4-knot current under a narrow span is a recipe for disaster.
- Precise Docking Maneuvers: Trying to dock a single-engine sailboat against a strong cross-current is incredibly difficult. Aiming for the slack period turns a challenging maneuver into a controlled one.
Planning for slack water or the very beginning of a flood tide gives you the calmest conditions. It minimizes the risk of being swept off course or into a hazard. By correctly applying reference and secondary station data, you move from guessing to knowing when these safe windows will occur at your exact location.
Timing Inlets and Bridges
Mastering tide tables is key when navigating through tight spots. You need exact data for safe passage. This is more than just knowing the tide levels.
When going through a tidal inlet, aim for slack water or early flood current. This helps you move in with the tide. For leaving, go during slack or early ebb current to aid your exit.
But, avoid strong ebb currents. They can create huge waves, making it hard to control your boat.
For accurate planning, check current stations. These give detailed flow speed and direction. Don’t just use a tide table for inlets.

Fixed bridges also pose a challenge. Your boat’s height must fit under the bridge at the right time.
Calculate your clearance: Chart Vertical Clearance + Predicted Tide Height. Compare this to your boat’s height. Add extra for wind and errors. Plan to pass when you have enough room.
Learning these skills takes you from basic to advanced navigation. You go from knowing tide heights to predicting water flow and space. Using current stations and precise calculations shows you’re ready.
Anchorage Depth Math with Swing & Range
Finding a safe anchorage is more than just picking a pretty spot. It needs precise calculations with the latest tide charts. A grounding at low tide can be stressful and damaging. With proper planning, you can avoid it.
Start by finding the lowest water level during your stay. Look at the tide charts for your anchorage’s reference station. Find the lowest low tide height for your dates. This number is key.
Vessel Draft + Safety Margin + Height of Low Tide = Required Minimum Depth.
Your vessel’s draft is fixed. Add 2 to 3 feet for sea state and error. Then, add the height of the predicted low tide above the chart datum. If the low tide is -1 foot, you need more depth.
This math shows the shallowest depth you can anchor. Always add extra depth for safety.
The tide range affects your swing room. Your boat swings around the anchor based on wind and current. At high tide, your rode is longer, making a wider circle.
At low tide, the circle gets smaller. Make sure the entire tide range swing circle is in water deeper than your minimum depth. This often means choosing a spot that seems too deep at high water.
Use a scope of 5:1 to 7:1 for your anchor rode. Multiply your maximum depth by 7. That’s how much room you need downwind. Add the boat’s length and the expanded swing circle from the tide range. This number tells if the anchorage is big enough.
Learning this math turns tide charts into powerful tools for securing your boat. It changes guesswork into a reliable, safe plan for a restful night on the hook.
Printable Planning Worksheet
Now, you have all the tools to plan your trip safely. A simple worksheet can help you use this knowledge well. It makes sure you’re ready to go before you leave.
Before you set off, write down important details. Note the times for high and low slack water. Also, record the tide heights and your depth calculations.
Mark the best times to cross inlets and bridges. Use data from NOAA PORTS or local stations. Don’t forget to include the wind forecast and important locations.
Don’t rely on memory alone. Use a worksheet, either digital or printed, to keep your information in order. This way, you won’t miss any important details. For more on understanding tides, check out this guide.
Always plan with the latest information and have a backup plan. As these guides suggest, carry a tide chart in your emergency kit. Your worksheet is the last step to turning theory into safe practice on the water.