

In many fields, success depends on a simple yet powerful idea: the operational window. This is a specific time when conditions are right for safe and efficient work.
Getting this safe period is crucial for outdoor, marine, or aviation projects. Missing it can cause delays, increase risks, and waste resources.
The best time to make these important decisions is in the 48 to 120-hour forecast. This two-to-five-day window is your actionable planning zone. It’s when you switch from watching forecasts to making your departure plans.
Experts look at key factors like significant wave height and wind speed. These numbers show what’s coming. For offshore work, a long gap in good weather directly affects profits.
It raises costs and cuts down on equipment use. Using exact forecast data during this time is key. It can make the difference between a successful operation and a costly failure.
Lead‑Up Timeline (D‑5 to D‑0)
A successful passage starts with a detailed timeline. This timeline turns weather forecasts into a clear plan. It’s your guide for the next five days, helping you build a risk matrix step by step.
Good planning goes beyond the latest forecast. It looks at past weather patterns too. By studying 12-year data, you learn how weather changes over time. This helps you understand what’s possible for your journey.
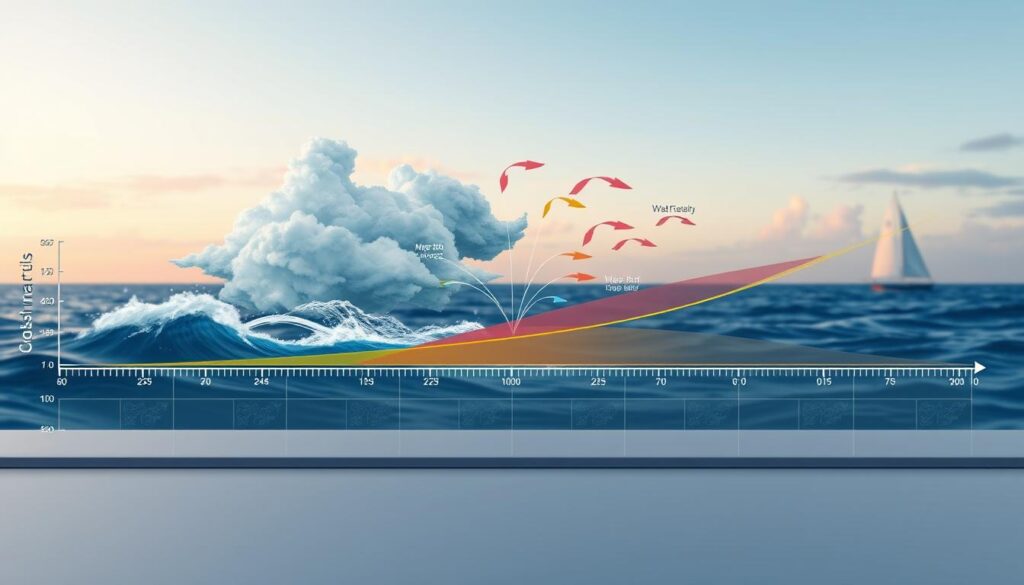
Each day, your focus gets sharper. You move from big weather patterns to exact wind speeds at your location. This daily focus helps turn data into a clear decision.
| Day | Primary Focus | Key Action |
|---|---|---|
| D-5 (120 hrs out) | Large-scale pattern & possible storm systems | Identify the dominant weather regime. Note any major lows or fronts developing. |
| D-3 (72 hrs out) | Model agreement on system timing & strength | Compare GFS, ECMWF, and other models. Analyze the “wait time” between favorable conditions. |
| D-2 (48 hrs out) | High-resolution model runs & refining criteria | Update your personal risk matrix with precise wind/wave forecasts for your route. |
| D-1 (24 hrs out) | Short-term trend & final model runs | Confirm the window is holding. Begin final preparations contingent on the D-0 check. |
| D-0 (Departure Day) | Nowcasting & real-time observations | Verify conditions match the forecast. Check buoy data, webcams, and sky conditions. |
At D-5, you’re a strategist. You look at the big picture for any storm risks. By D-3, you focus on model agreement for front timing and good weather duration.
The D-2 mark is for detailed planning. High-resolution models give you exact wind and wave data. This is your active risk assessment phase. You’re now making decisions.
D-0 is for validation. All data must match what you see and hear. This is the time for real-time local observations. Check the latest buoy reports and live webcam of the harbor entrance. Your final decision is based on this.
This timeline reduces uncertainty. It turns a stressful decision into a calm, informed process. Each day, you gather more evidence, increasing your confidence in the weather window.
Model Convergence & Confidence
The key to a confident go/no-go call is understanding how forecast models come together. In the 48 to 120-hour window before your trip, models often show different pictures. This shows the atmosphere’s initial uncertainty.
As the event gets closer, these models should agree on a single outcome. This is called convergence.
You can see this with a “spaghetti plot,” which shows many forecast lines. When lines are far apart, the forecast spread is high, and confidence is low. When lines come together tightly, the spread is low, and forecasters are more confident.
Watching the spread shrink over time shows a forecast solidifying. This happens because of constant data collection. Systems like the European Centre’s (ECMWF) use continuous Data Assimilation.
This process feeds new, real-world observations into the model’s starting point. By using more accurate data, the model can predict better. This can gain an extra 2-3 hours of predictability and improve forecast scores by about 2%.
For your trip planning, expect some forecast disagreement four or five days out. Understanding why forecasts disagree at that range is normal. Your job is to watch the trend.
Are the models starting to cluster around a similar solution as you get within 48 hours? That growing consensus is your green light to trust the forecast and make a final go/no-go decision.

Never base a critical decision on a single model run, when the spread is wide. The move from a chaotic bundle of possibilities to a single, confident forecast line is key. When the models converge, your confidence can too.
Swell/Period/Stability Scorecard
A scorecard simplifies the complex mix of swell, period, and wind into a simple stability grade. It helps you move past just looking at wave height. It lets you make a full stability check for your departure planning.
Why do all three factors matter? Each one tells a different part of the sea state story.
- Swell Height (Significant Wave Height – Hs): This is the average height of the highest third of waves. It’s key for vessel stress and passenger comfort. Most guides, like for Crew Transfer Vessels, set clear Hs limits.
- Wave Period: Often overlooked, period is the time between successive wave crests. Short-period waves (e.g., 5-7 seconds) are steep and choppy. Long-period swell (e.g., 14+ seconds) is more organized and predictable, allowing for a smoother ride even with moderate height.
- Wind Stability: This isn’t just about speed. Sustained wind direction determines how waves build. A persistent wind from one direction creates a more organized sea state than shifting winds. Wind persistence is a critical factor for safe departure planning.
Professional forecasters use joint constraint analysis to find true sailing windows. They don’t just look at waves or wind alone. They ask: “How often do both Hs *and* wind speed stay below our thresholds for the needed duration?” This approach mirrors the operational forecasting methodology used by professional services, which relies on creating persistence tables from historical data.
You can build a simple version for your boat. Use the table below as a starting point, inspired by common vessel thresholds. Adjust the numbers based on your vessel’s size, design, and crew experience.
| Parameter | Favorable | Marginal (Proceed with Caution) | Unfavorable (Delay) |
|---|---|---|---|
| Significant Wave Height (Hs) | Below 1.5 meters (5 ft) | 1.5 – 2.5 meters (5-8 ft) | Above 2.5 meters (8 ft) |
| Dominant Wave Period | 12 seconds or longer | 8 – 11 seconds | Below 8 seconds |
| Wind Persistence | Steady direction & speed for 12+ hrs | Direction shifts < 45° over 12 hrs | Direction shifting > 45° or speed gusting +50% |
To use the scorecard, grade each parameter for your forecast window. Three “Favorable” ratings suggest a green light. One “Unfavorable” rating is often a deal-breaker. A mix of “Marginal” ratings requires careful risk evaluation based on your route and alternatives.
This scorecard transforms a complex forecast into a clear departure planning tool. It forces you to consider stability, not just size, turning raw data into a confident go/no-go decision.
Bail‑Out Ports & Turn‑Back Rules
A good weather plan needs a backup plan. The most important decisions come when the weather changes. You must have bail-out ports and turn-back rules ready before you leave.
A bail-out port is a safe place on your route. It’s not just any marina. It must protect you from bad weather and have the facilities you need, like fuel.
When picking these ports, use a checklist:
- Shelter: Does the harbor protect you from wind and swell?
- Access: Is the entrance easy in bad weather or rough seas? Avoid ports with tricky bars or narrow channels.
- Facilities: Can you get fuel, water, or basic supplies if stuck for a day or two?
- Spacing: Place them at realistic intervals along your route, considering your boat’s speed and crew endurance.
Turn-back rules are your personal minimums. They are objective triggers that tell you to stop the passage. Write them down and share with your crew.
Common turn-back triggers include:
- Sustained winds exceed a specific speed you’ve predetermined for your vessel and crew.
- Seas become steep and confused, causing consistent, uncomfortable pounding or rolling.
- A crew member becomes seasick or injured to a degree that affects safe operations.
- A critical system fails—like autopilot, navigation instruments, or engine—and cannot be fixed underway.
- Visibility drops below a safe margin, specially near land or traffic.
Mark these decision points on your chart or plotter. A decision point is a specific location, like a buoy or waypoint, where you will evaluate conditions against your rules. If a trigger is met, you execute the plan and head to your nearest safe harbor. There is no debate.
This level of planning shows experience, not timidity. It turns a crisis into a managed change of plans. Your crew will have confidence knowing there’s a clear, pre-agreed path to safety. Review these bail-out ports and turn-back rules during your crew briefing. Ensure everyone understands the plan and the triggers.
Remember, using an escape route is a successful outcome. It means your system worked. You identified a risk and executed a safe alternative. The goal is always a safe voyage, not just sticking to the original plan.
Post‑Trip Review Template
The final sail home marks the start of a new phase. A thorough review turns your experience into useful data. This step makes your planning better for the next time.
Start with a simple post-trip template. First, compare the forecasted weather to what you actually faced. Note any big differences in wind, swell, or period. This shows how accurate your sources were.
Next, check your decisions against your turn-back rules. Did you stick to your dynamic risk matrix? Checking this confirms if your safety limits were right.
Then, document the operational outcome. Think about wait times between good windows, as studies suggest. High costs come from unplanned changes. Learning from this reduces costs later.
Your review closes the feedback loop. It turns one trip into a learning experience. This practice sharpens your weather window decisions. Every voyage adds to your personal database.
Keep the review brief. Focus on key lessons that will change your next plan. This habit makes you a more skilled mariner. Your personal risk matrix grows with each journey.